
Editor’s Note: This story originally appeared on LawnStarter.
City living has its advantages, but with greater population density often comes an assortment of problems such as pests, litter, and pollution that can turn any city from sparkling to filthy.
Some cities are dirtier than others. How does your city compare with the others in our ranking?
LawnStarter ranked nearly 90 of the biggest U.S. cities across four key categories, including pollution, living conditions, infrastructure, and consumer satisfaction.
Find out how your city fared in our ranking next, with methodology details at the end.
Depending on where you live, you may want to buy some air fresheners, mouse traps, or a can of Raid.
1. Newark, NJ
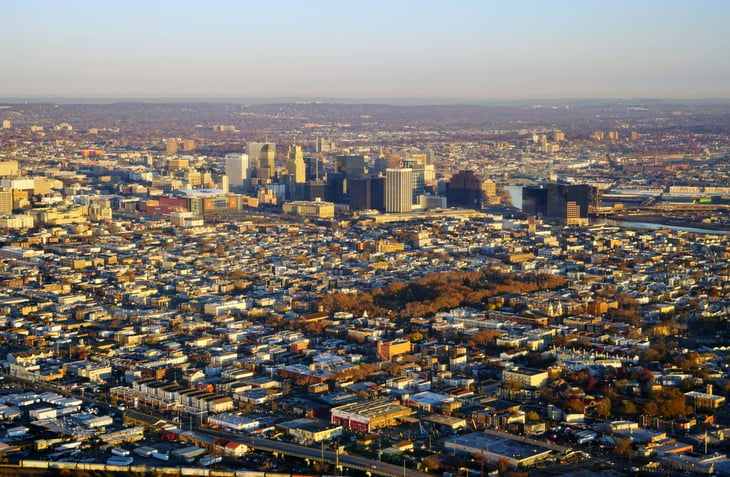
Overall score: 52.97
Pollution rank: 13
Living conditions rank: 21
Infrastructure rank: 43
Consumer satisfaction rank: 2
2. Houston, TX

Overall score: 50.12
Pollution rank: 9
Living conditions rank: 7
Infrastructure rank: 28
Consumer satisfaction rank: 20
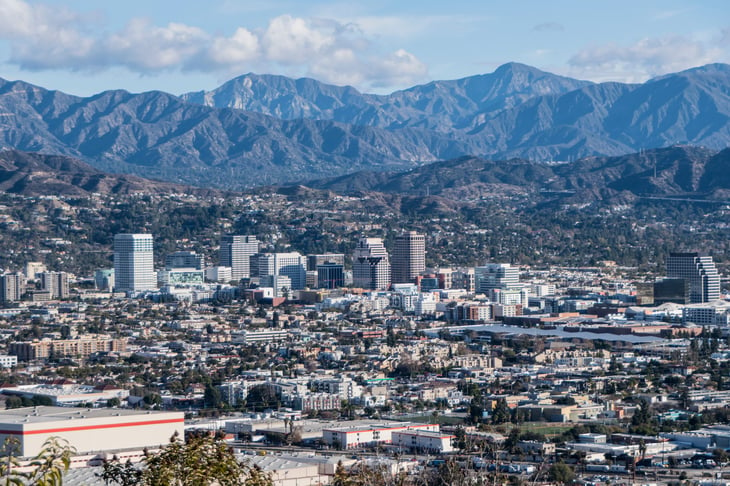
3. Los Angeles, CA
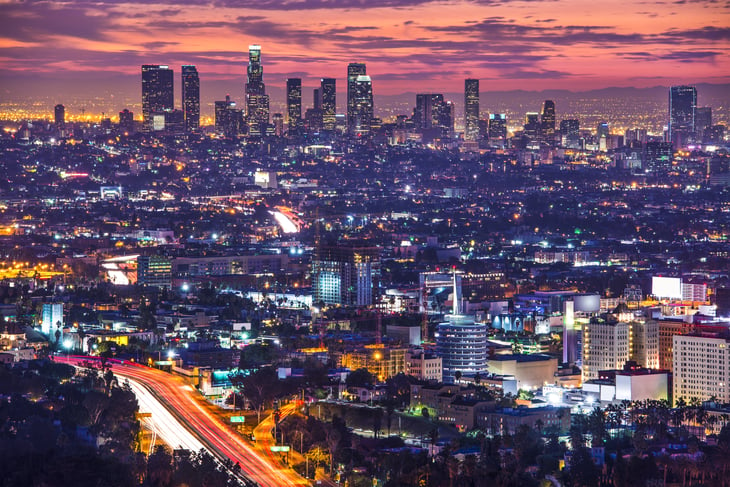
Overall score: 49.87
Pollution rank: 21
Living conditions rank: 5
Infrastructure rank: 31
Consumer satisfaction rank: 5
4. San Bernardino, CA
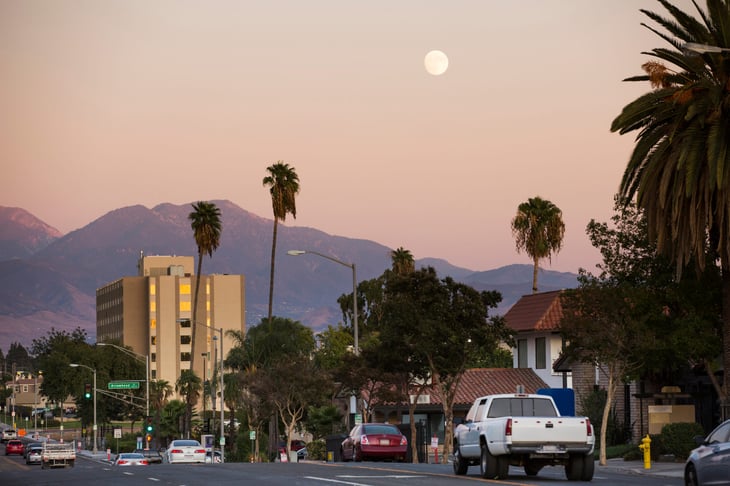
Overall score: 49.79
Pollution rank: 2
Living conditions rank: 41
Infrastructure rank: 62
Consumer satisfaction rank: 1
5. Oklahoma City, OK

Overall score: 49.01
Pollution rank: 10
Living conditions rank: 3
Infrastructure rank: 5
Consumer satisfaction rank: 67
6. San Antonio, TX

Overall score: 46.92
Pollution rank: 30
Living conditions rank: 2
Infrastructure rank: 25
Consumer satisfaction rank: 22
7. Las Vegas, NV
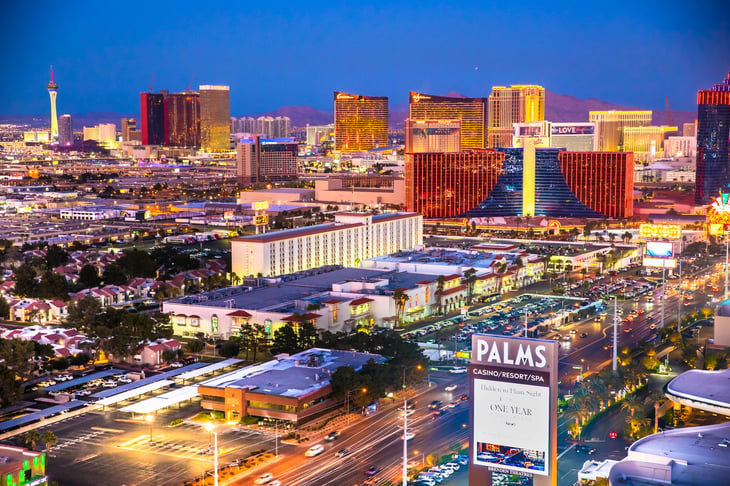
Overall score: 45.91
Pollution rank: 19
Living conditions rank: 42
Infrastructure rank: 2
Consumer satisfaction rank: 21
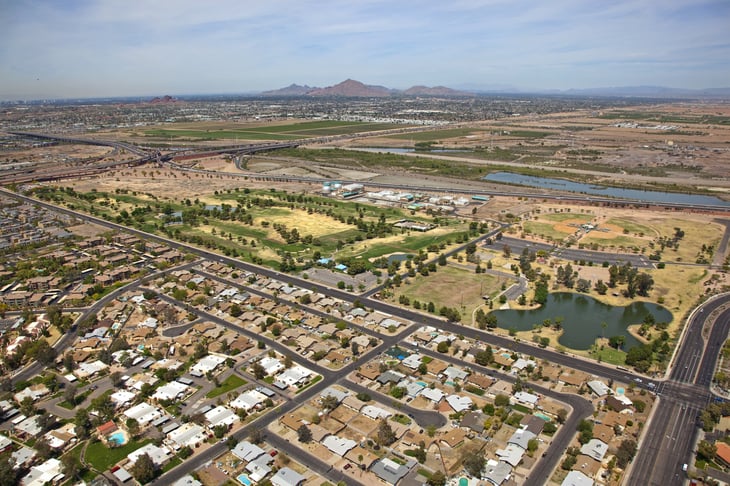
8. Phoenix, AZ

Overall score: 45.55
Pollution rank: 6
Living conditions rank: 54
Infrastructure rank: 9
Consumer satisfaction rank: 23
9. Glendale, CA
Overall score: 43.89
Pollution rank: 20
Living conditions rank: 19
Infrastructure rank: 13
Consumer satisfaction rank: 47
10. Chicago, IL

Overall score: 43.41
Pollution rank: 27
Living conditions rank: 4
Infrastructure rank: 73
Consumer satisfaction rank: 24
11. Anaheim, CA
Overall score: 42.75
Pollution rank: 23
Living conditions rank: 27
Infrastructure rank: 66
Consumer satisfaction rank: 14
12. Mesa, AZ
Overall score: 42.62
Pollution rank: 8
Living conditions rank: 53
Infrastructure rank: 20
Consumer satisfaction rank: 28
13. Cleveland, OH

Overall score: 42.2
Pollution rank: 15
Living conditions rank: 31
Infrastructure rank: 14
Consumer satisfaction rank: 45
14. New York, NY

Overall score: 42.19
Pollution rank: 54
Living conditions rank: 1
Infrastructure rank: 49
Consumer satisfaction rank: 6
15. Memphis, TN

Overall score: 42
Pollution rank: 70
Living conditions rank: 8
Infrastructure rank: 12
Consumer satisfaction rank: 10
Methodology

We ranked 87 of the biggest U.S. cities from dirtiest (No. 1) to cleanest (No. 87) based on their overall scores (out of 100 possible points), averaged across all the weighted metrics listed below.
We began with an initial sample comprising the 200 biggest U.S. cities. We then eliminated the cities — 113 total — lacking data for more than 10% of the total metrics in a single category.
The 87 cities that remained in our sample were then scored and ranked only on the metrics for which data were available. In most cases, a city lacked data for only one out of 23 total metrics and was limited to two maximum for the fairest possible comparison:
- Median Air Quality Index
- Presence of Water Quality Violations
- Greenhouse-Gas Emissions (Metric Tons CO2e)
- Annual Excess Fuel Consumption (Gallons per Auto Commuter)
- Population Density (Residents per Square Mile)
- Share of Overcrowded Homes
- Share of Homes with No Kitchen Facilities
- Share of Homes with No Plumbing Facilities
- Share of Homes with Mold in Last 12 Months
- Share of Homes with Signs of Mice or Rats in Last 12 Months
- Share of Homes with Signs of Cockroaches in Last 12 Months
- Share of Homes with Sewage Disposal Breakdowns in Last 3 Months
- Unsheltered Homeless Rate (per 1,000 Residents)
- Tons of Waste in Landfills per 100,000 Residents
- Rating of State Waste Regulations and Measures
- Refuse and Recycling Collectors per 100,000 Residents
- Share of Roads in Poor Condition
- Alternative-Fuel Stations per 100,000 Residents
- Number of Junk Yards
- Share of Residents Who Find City Dirty and Untidy
- Share of Residents Dissatisfied with Pollution
- Share of Residents Dissatisfied with Garbage Disposal
- Share of Residents Dissatisfied with Greenery and Parks
Sources: County Health Rankings & Roadmaps, LawnStarter, National Transportation Research Nonprofit (TRIP), Numbeo, Salvage-Parts.com, Texas A&M Transportation Institute, U.S. Bureau of Labor Statistics, U.S. Census Bureau, U.S. Department of Energy, U.S. Department of Housing and Urban Development, U.S. Environmental Protection Agency